

PRODUCER DASHBOARD
OVERVIEW
Producers at PBS LearningMedia struggled with information overload and being able to take action on pending tasks. We designed an internal dashboard to make producer tasks clearer, faster, and easier, resulting in reducing time spent on producing resources by 40% that we obtained through internal testing. (B2B, SaaS)
ROLE
Senior Interactive Designer, PBS LearningMedia
MEDIUM
Desktop (Figma and Pen/Paper)
TIMELINE
2024-2025
THE TEAM
1 Sr. Interactive Designer, 1 Product Manager, 1 Sr. Director of Product, 1 Sr. Editorial Director, 1 Sr. Content Manager, Team of developers
Live site not available as this is an internal B2B SaaS enterprise tool.
THE PROBLEM
We recently redesigned our backend process for how producers publish on PBS LearningMedia. We noticed that users were still spending a lot of time on the homepage of the backend before they could get where they needed to go. Whether they were waiting on an item to be reviewed or needed to take actions on an item that had been reviewed by PBS staff.
THE CURRENT EXPERIENCE
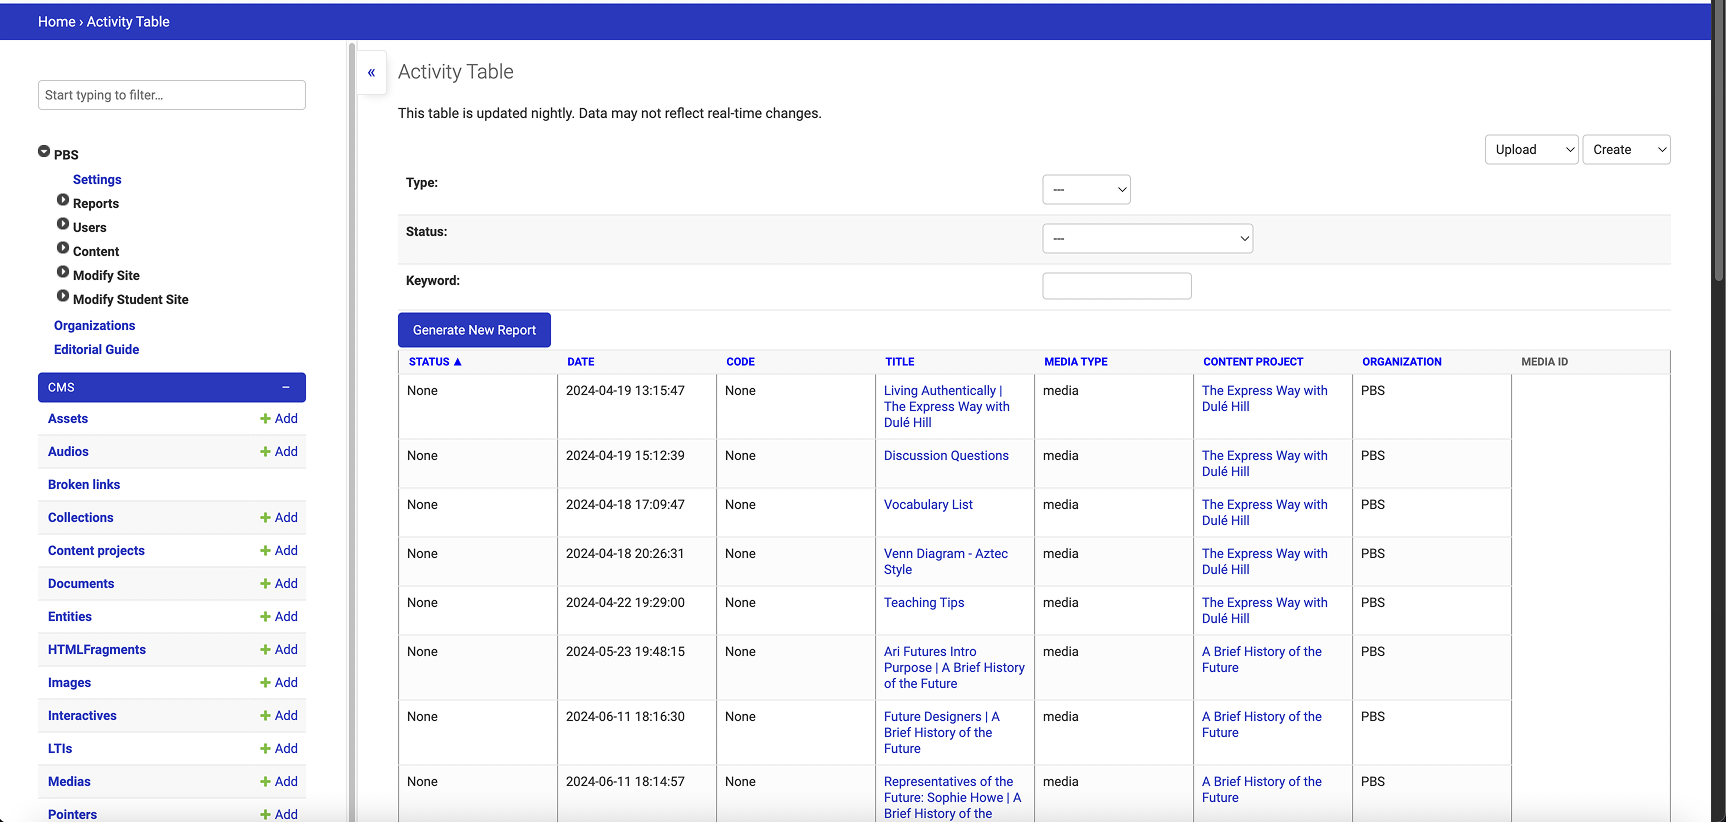
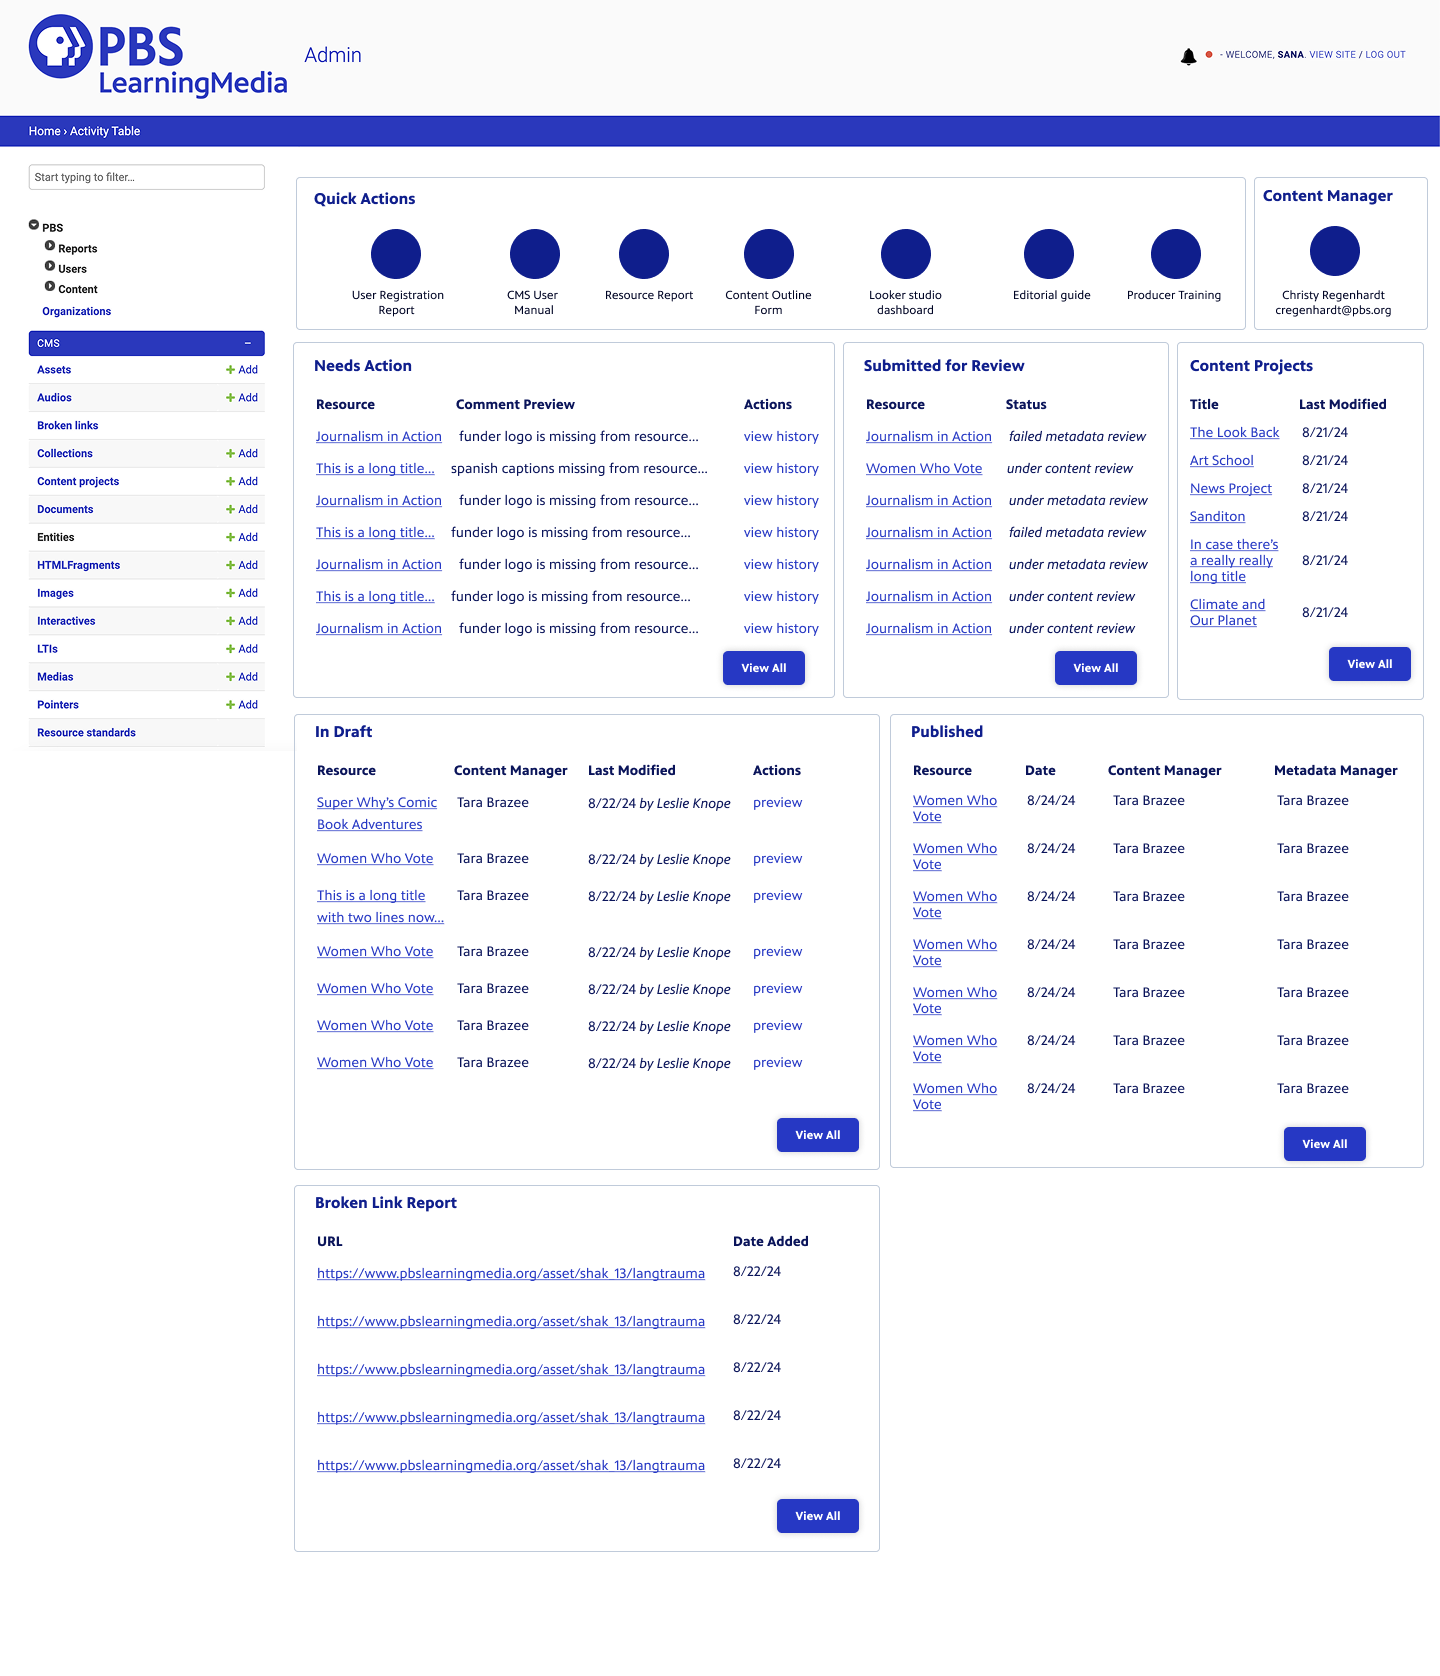
The initial dashboard
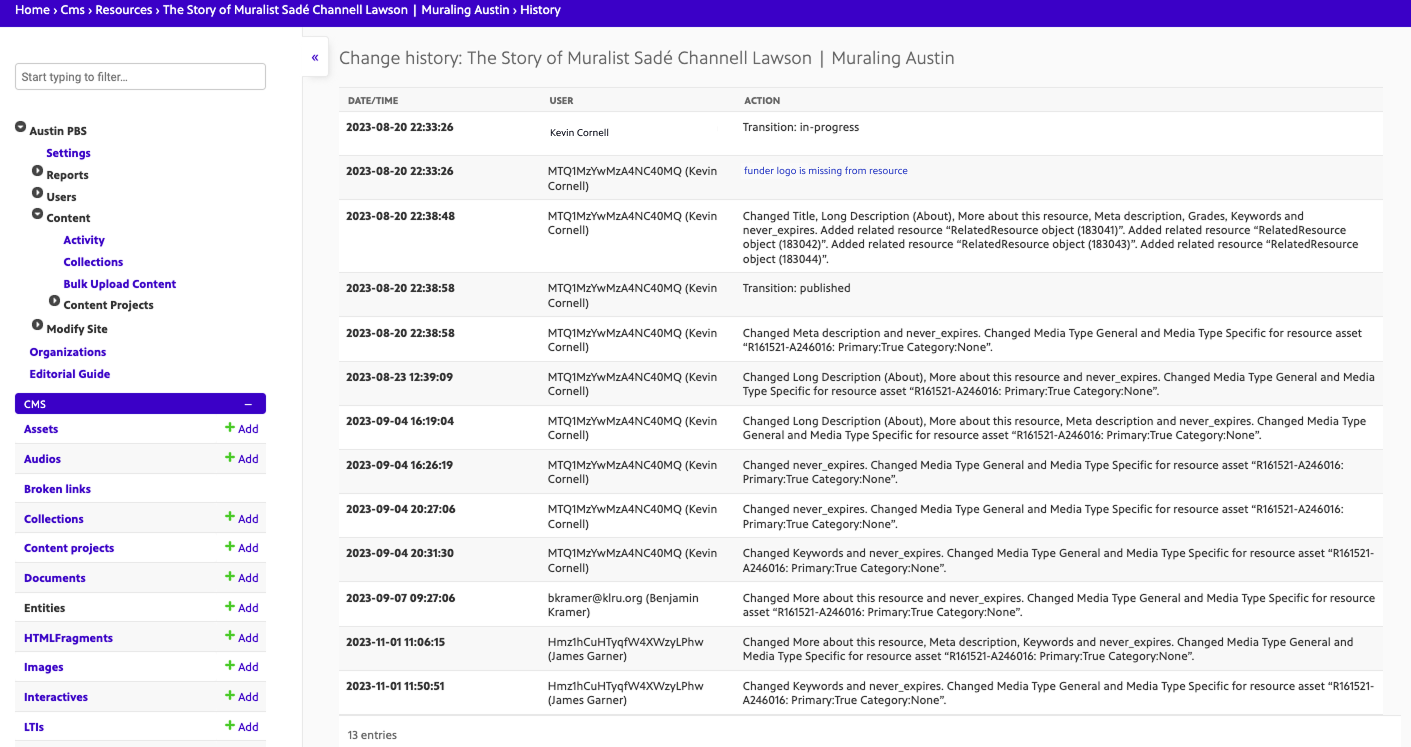
The comment preview page
Below is the table that showcased all of the different statuses. The issue is that at initial glance it is difficult for a producer to know what action to take, even once they know the status.
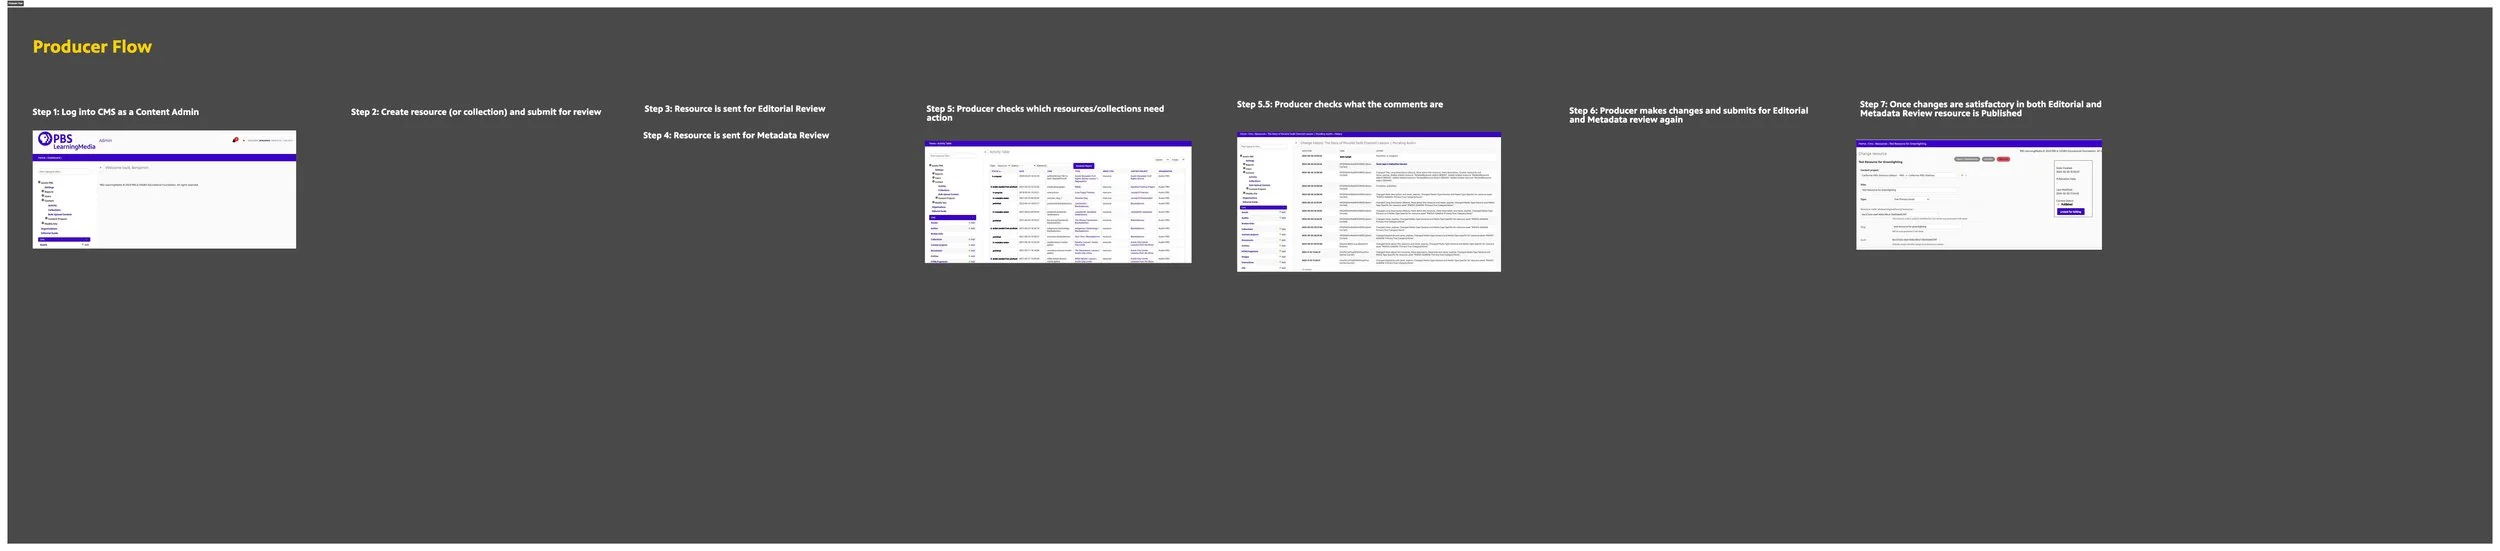
DOCUMENTING THE PRODUCER JOURNEY
For context, these are the steps a producer now needs to take to publish content on PBS LearningMedia:
Producer logs in as a Content Admin
Create a resource/collection and submit for review
Resource is sent for Editorial and Metadata review (2 separate review processes)
Producer checks which assets need action
Producer reads through comments and makes amendments then submits for Editorial and Metadata review again
Once changes are satisfactory in both Editorial and Metadata review then resource is published
BENTO BOX UI FRAMEWORK
Now that we knew the process, we needed a framework that could contain all of the different pieces of information. To keep up with industry trends as well as visualize all of this complex information, I researched bento box UI. I presented it as a solution to our developers to make sure it was feasible for our current tech stack.
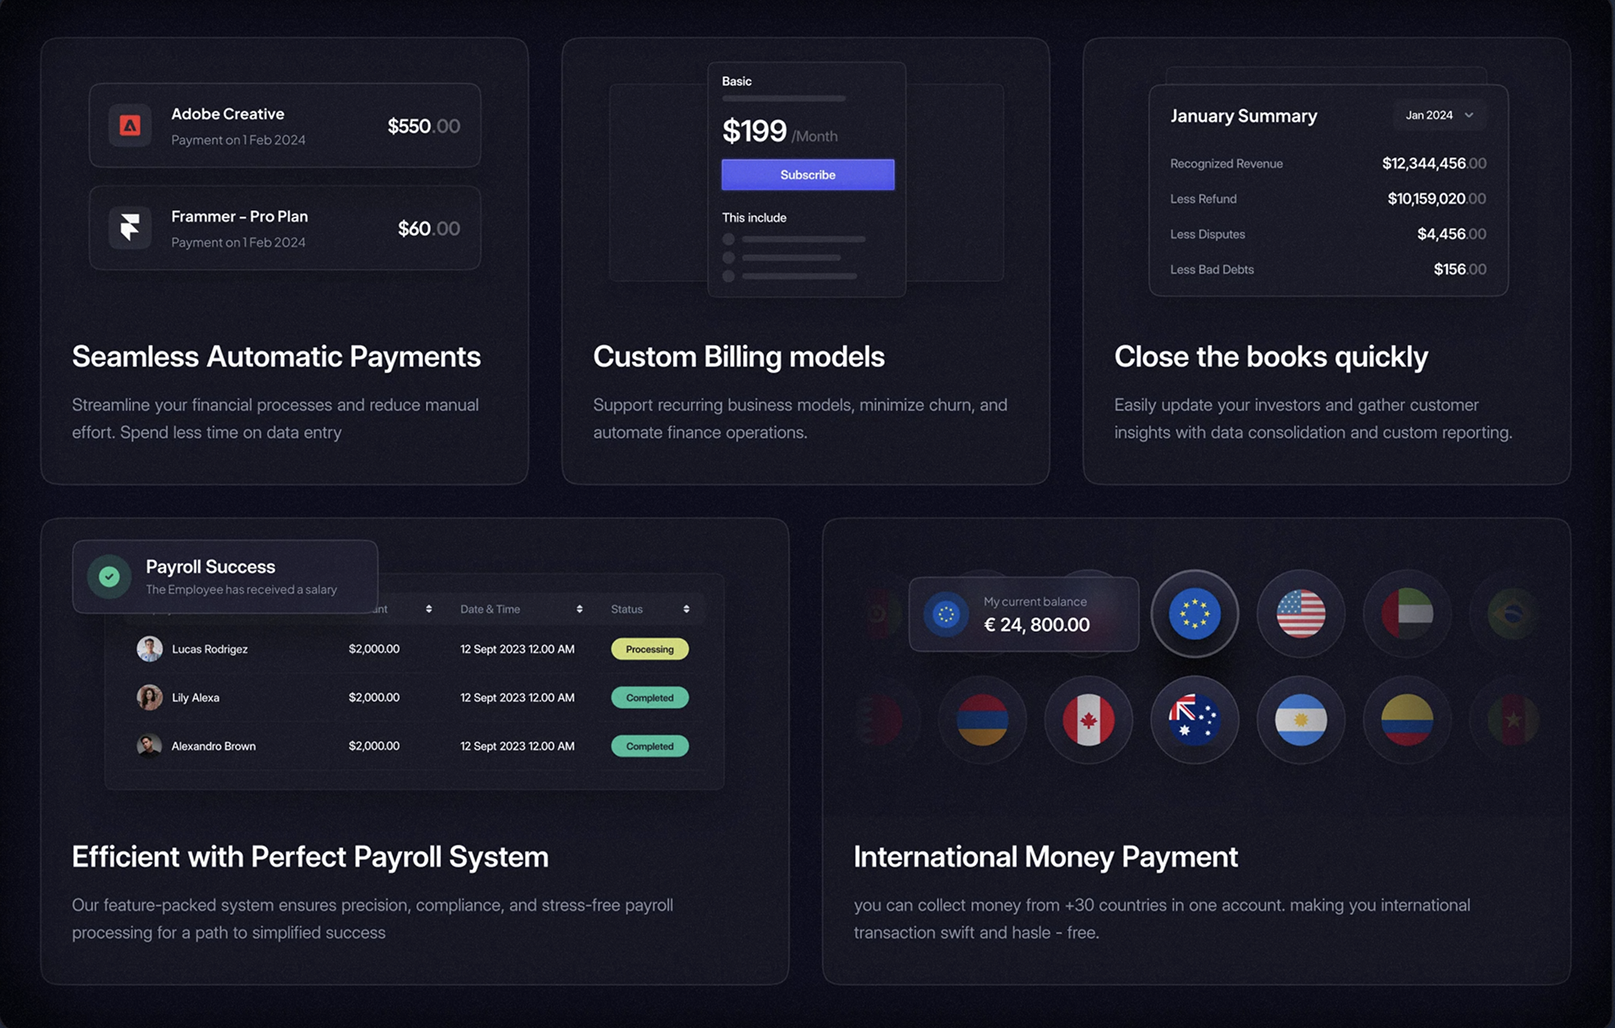
Screenshot taken from Mobbin
INITIAL IDEAS
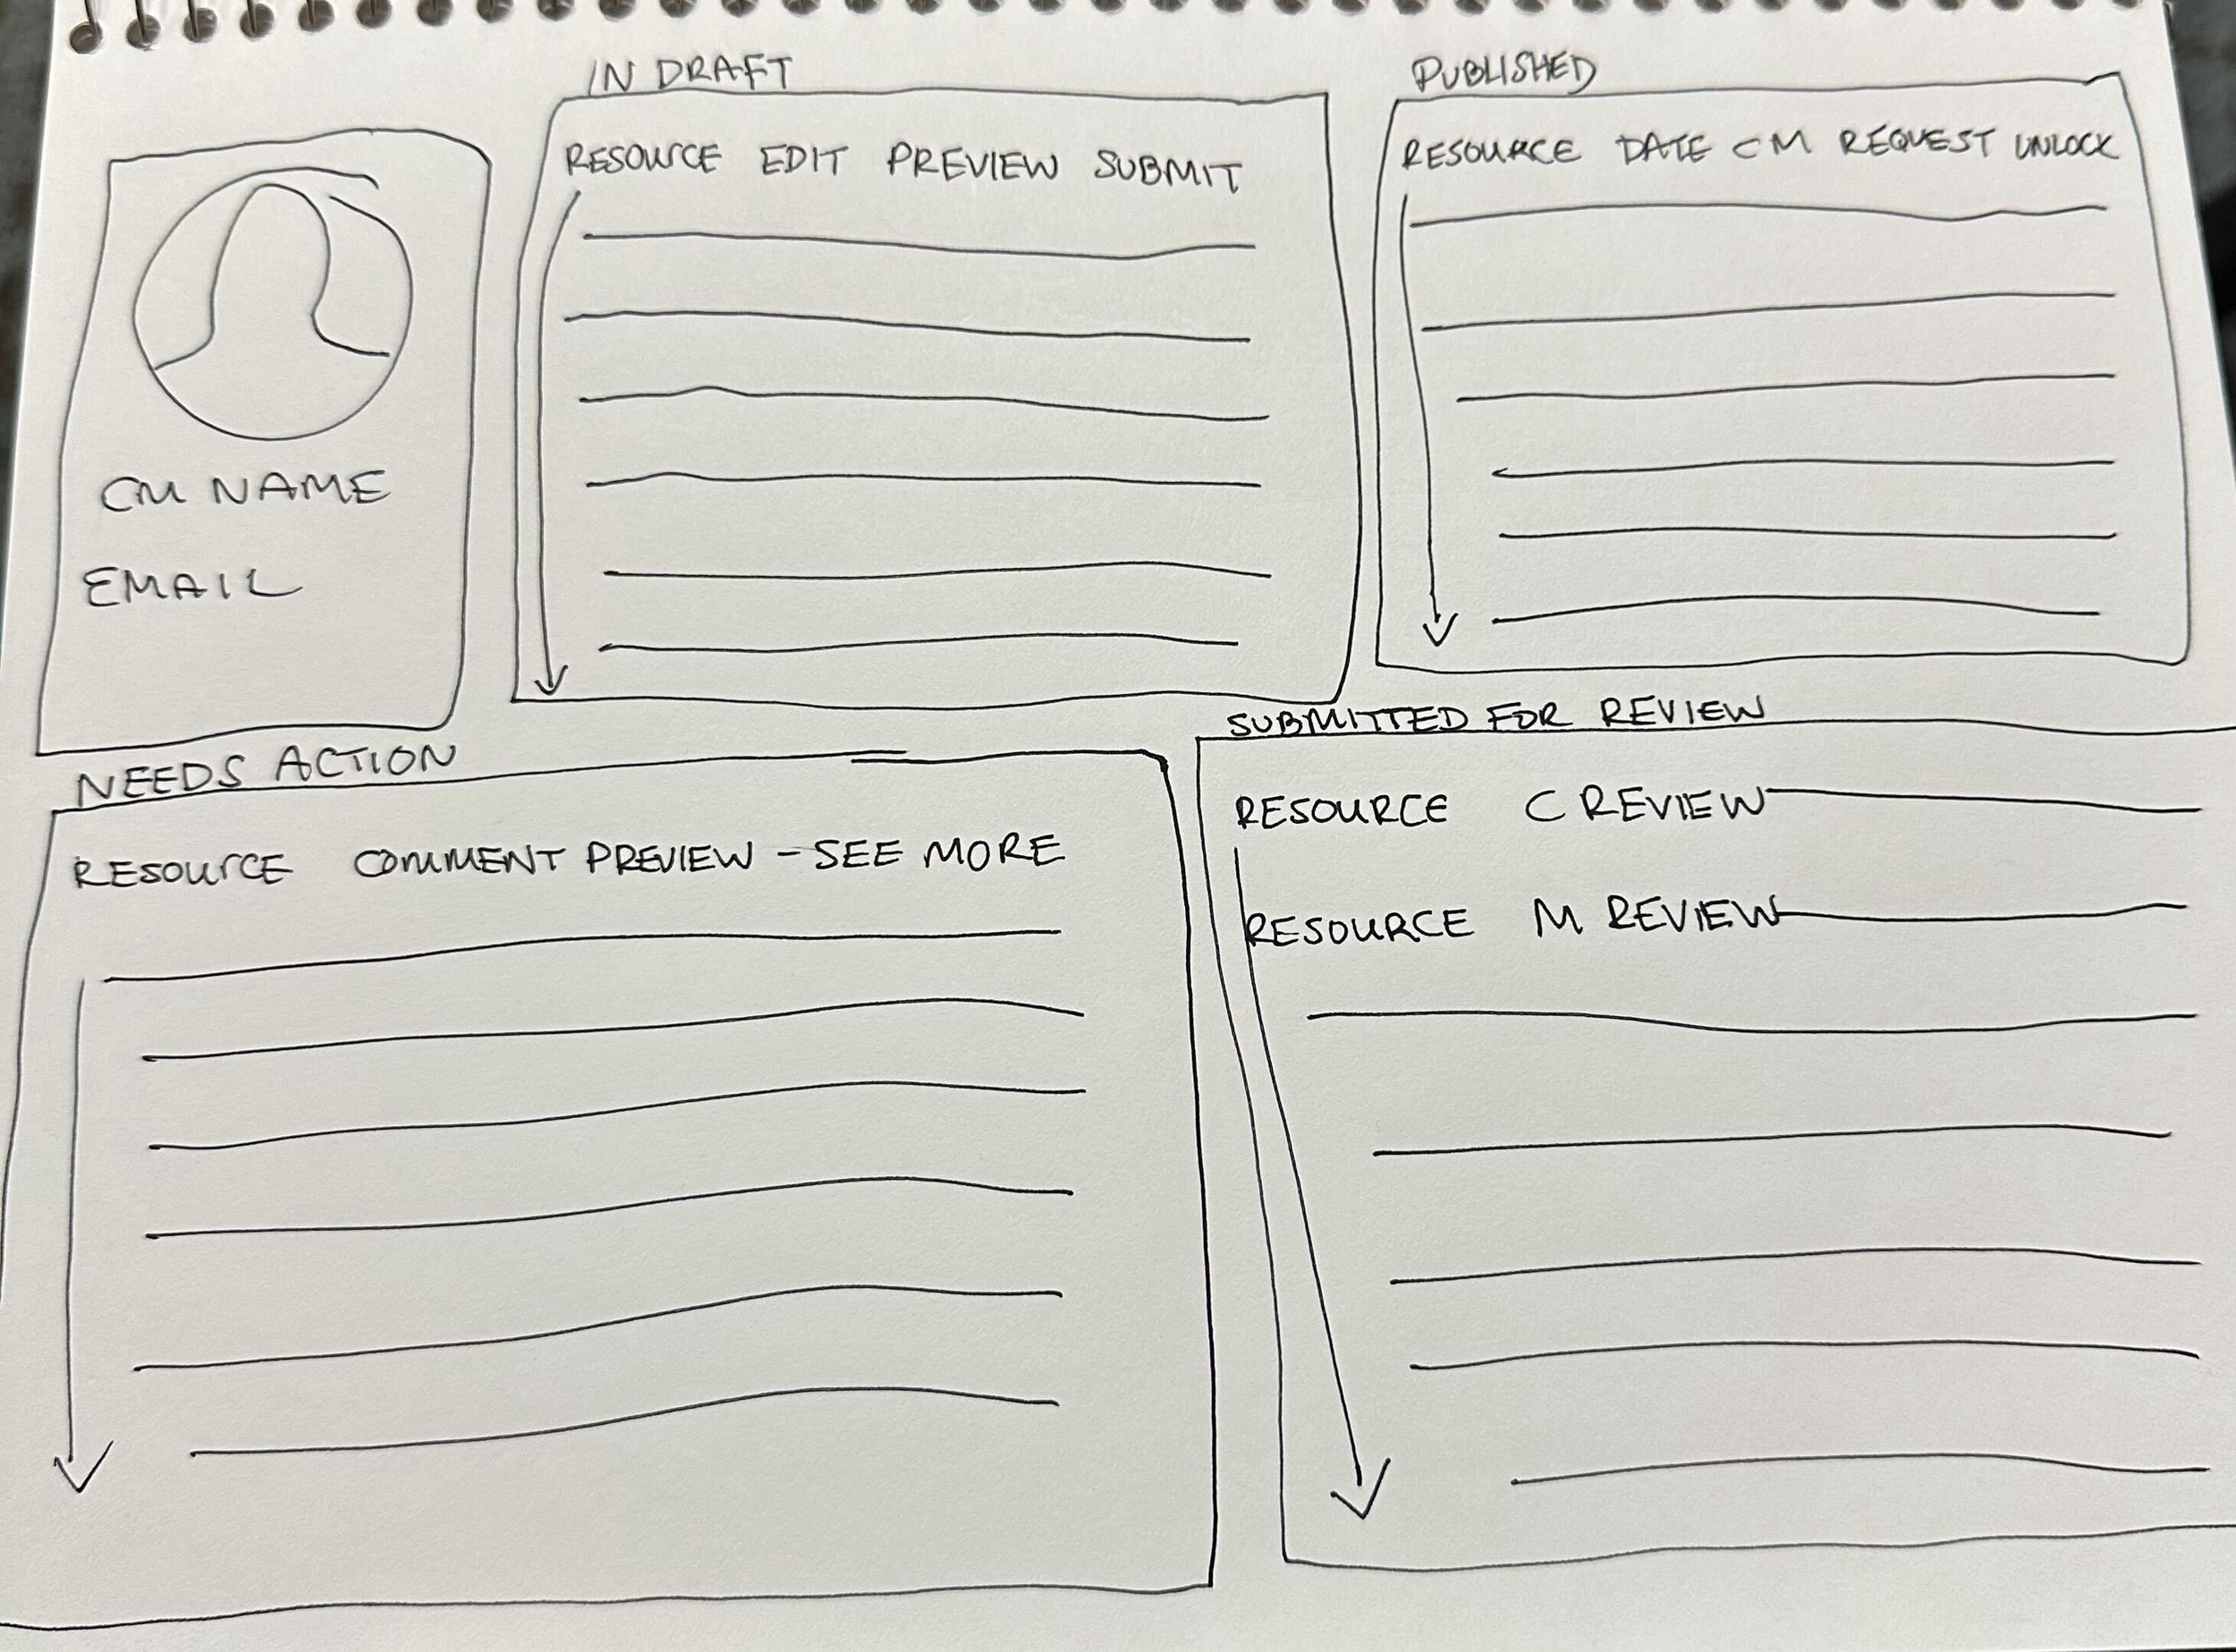
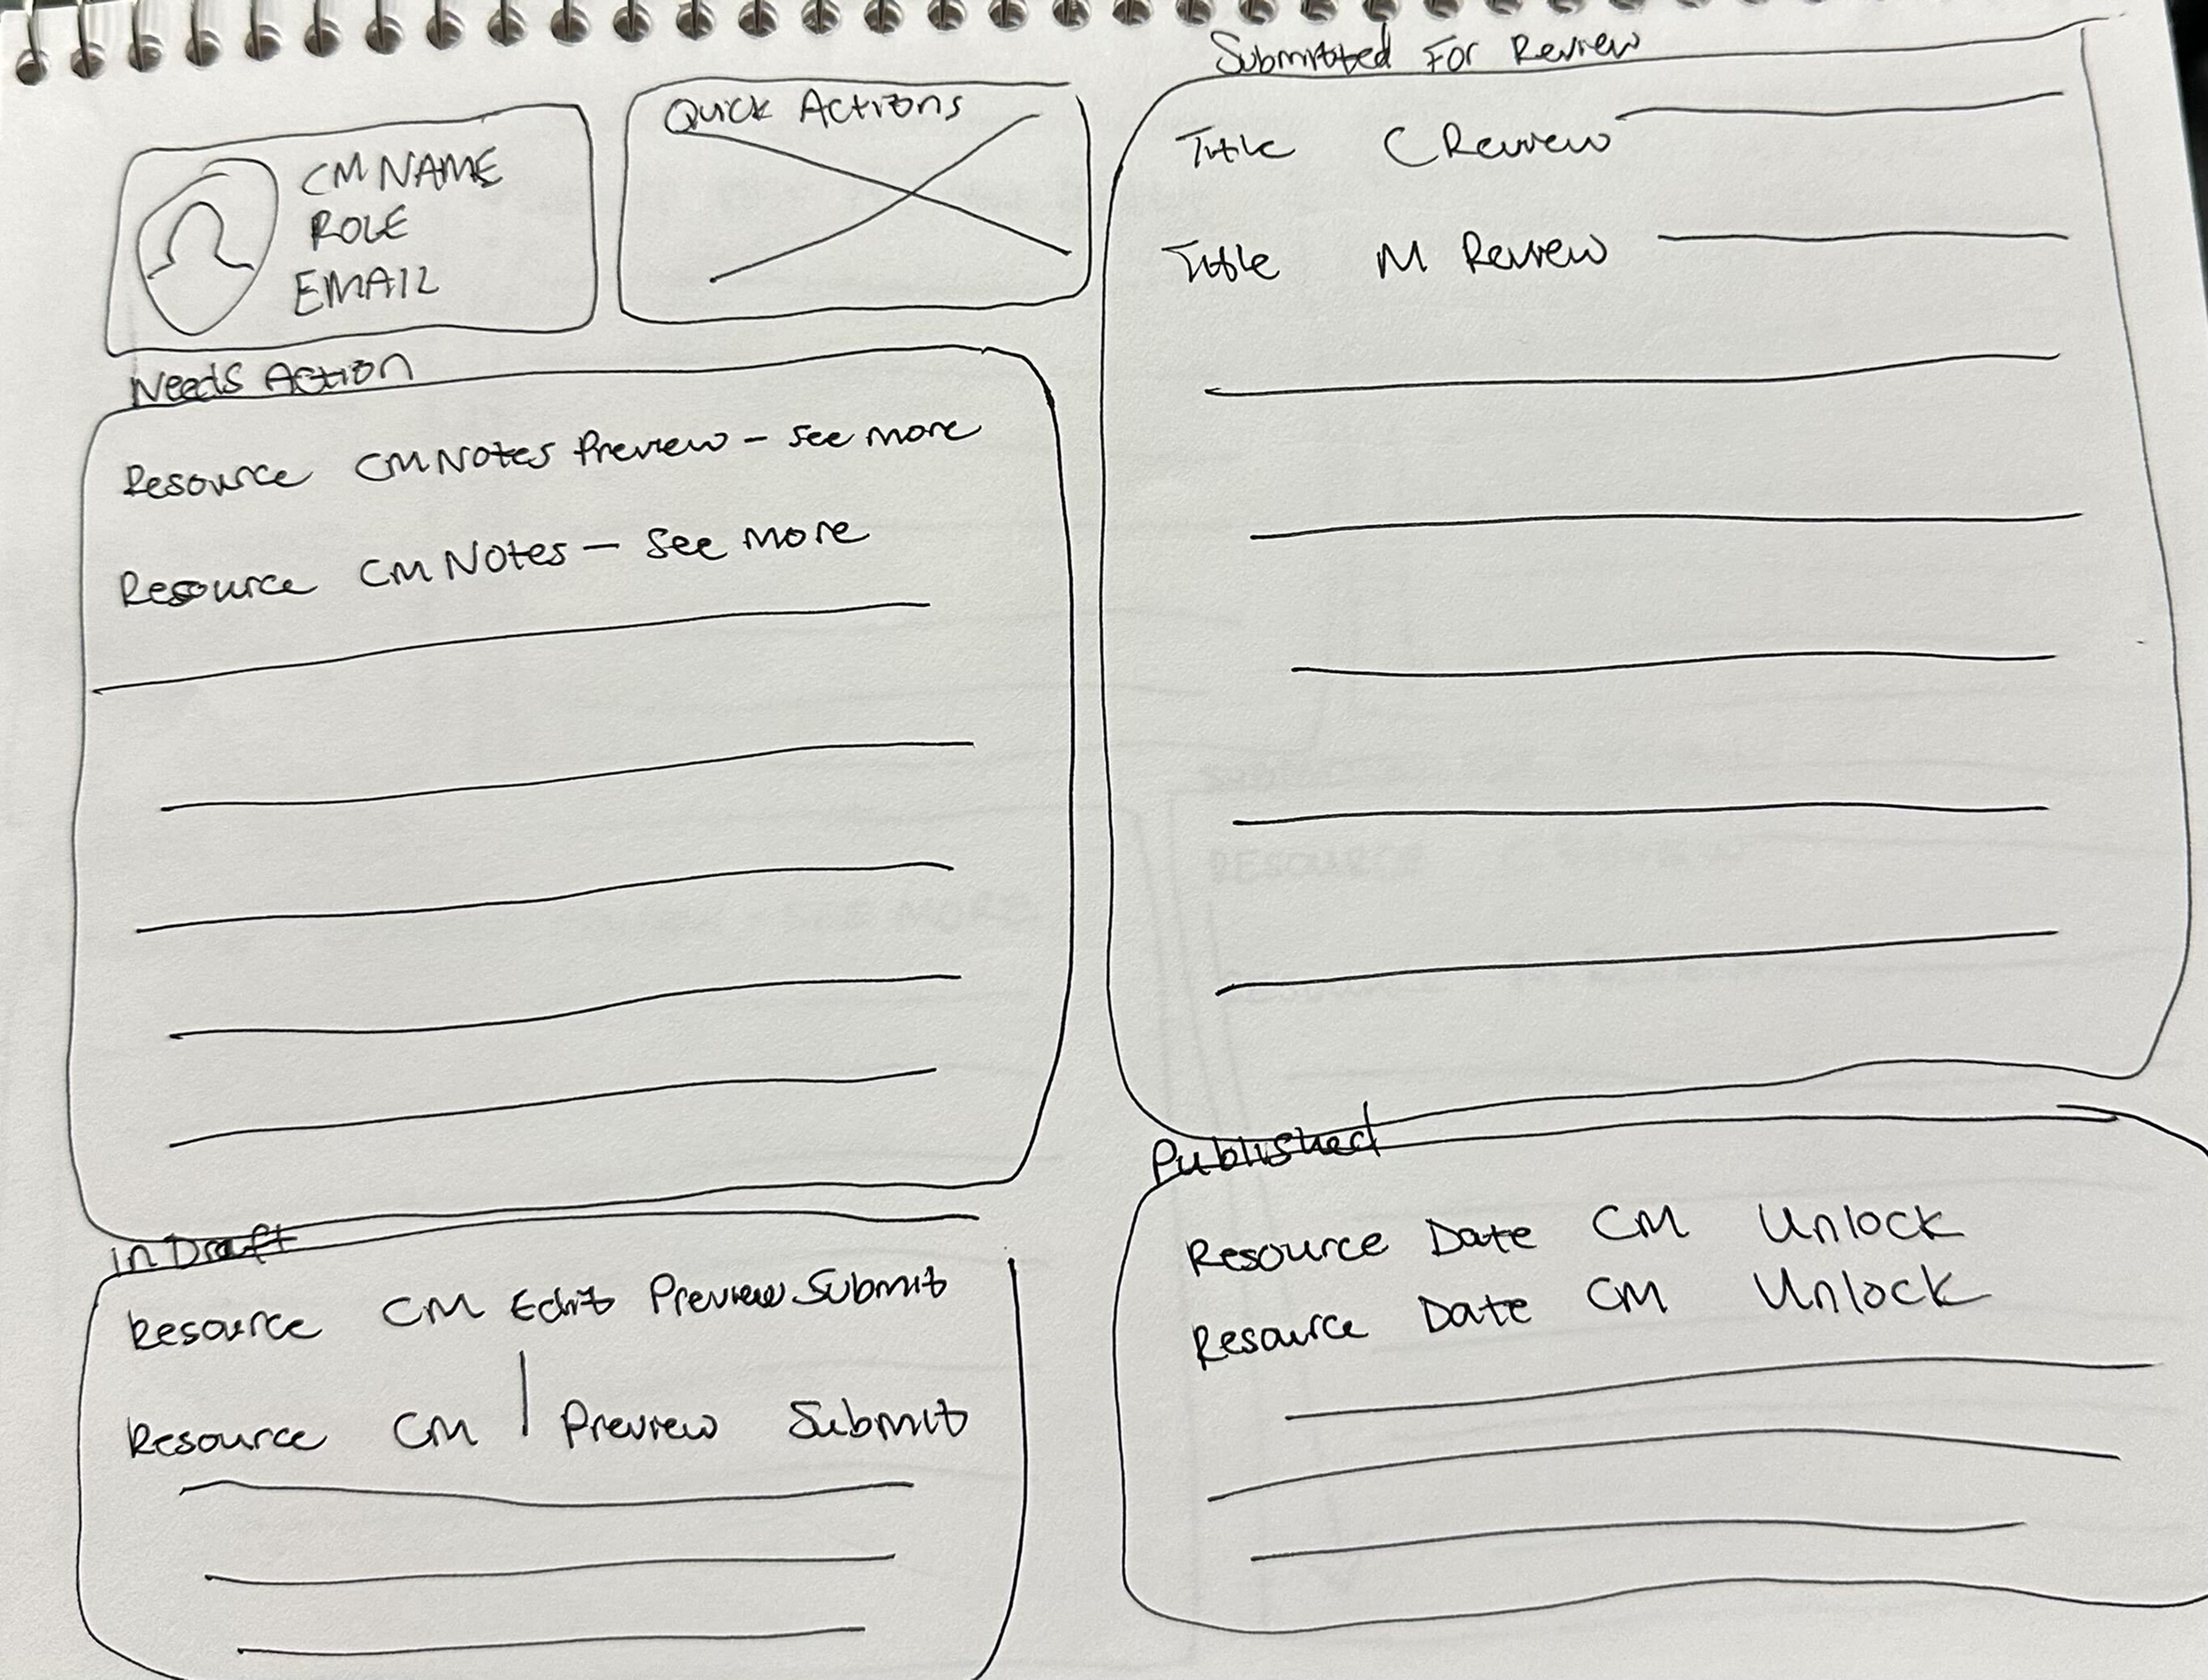
Initial Sketches
With our insights from user interviews and developer conversations I began sketching ideas and thinking about what information would need to be presented and how they could be sectioned into different “bento boxes”.
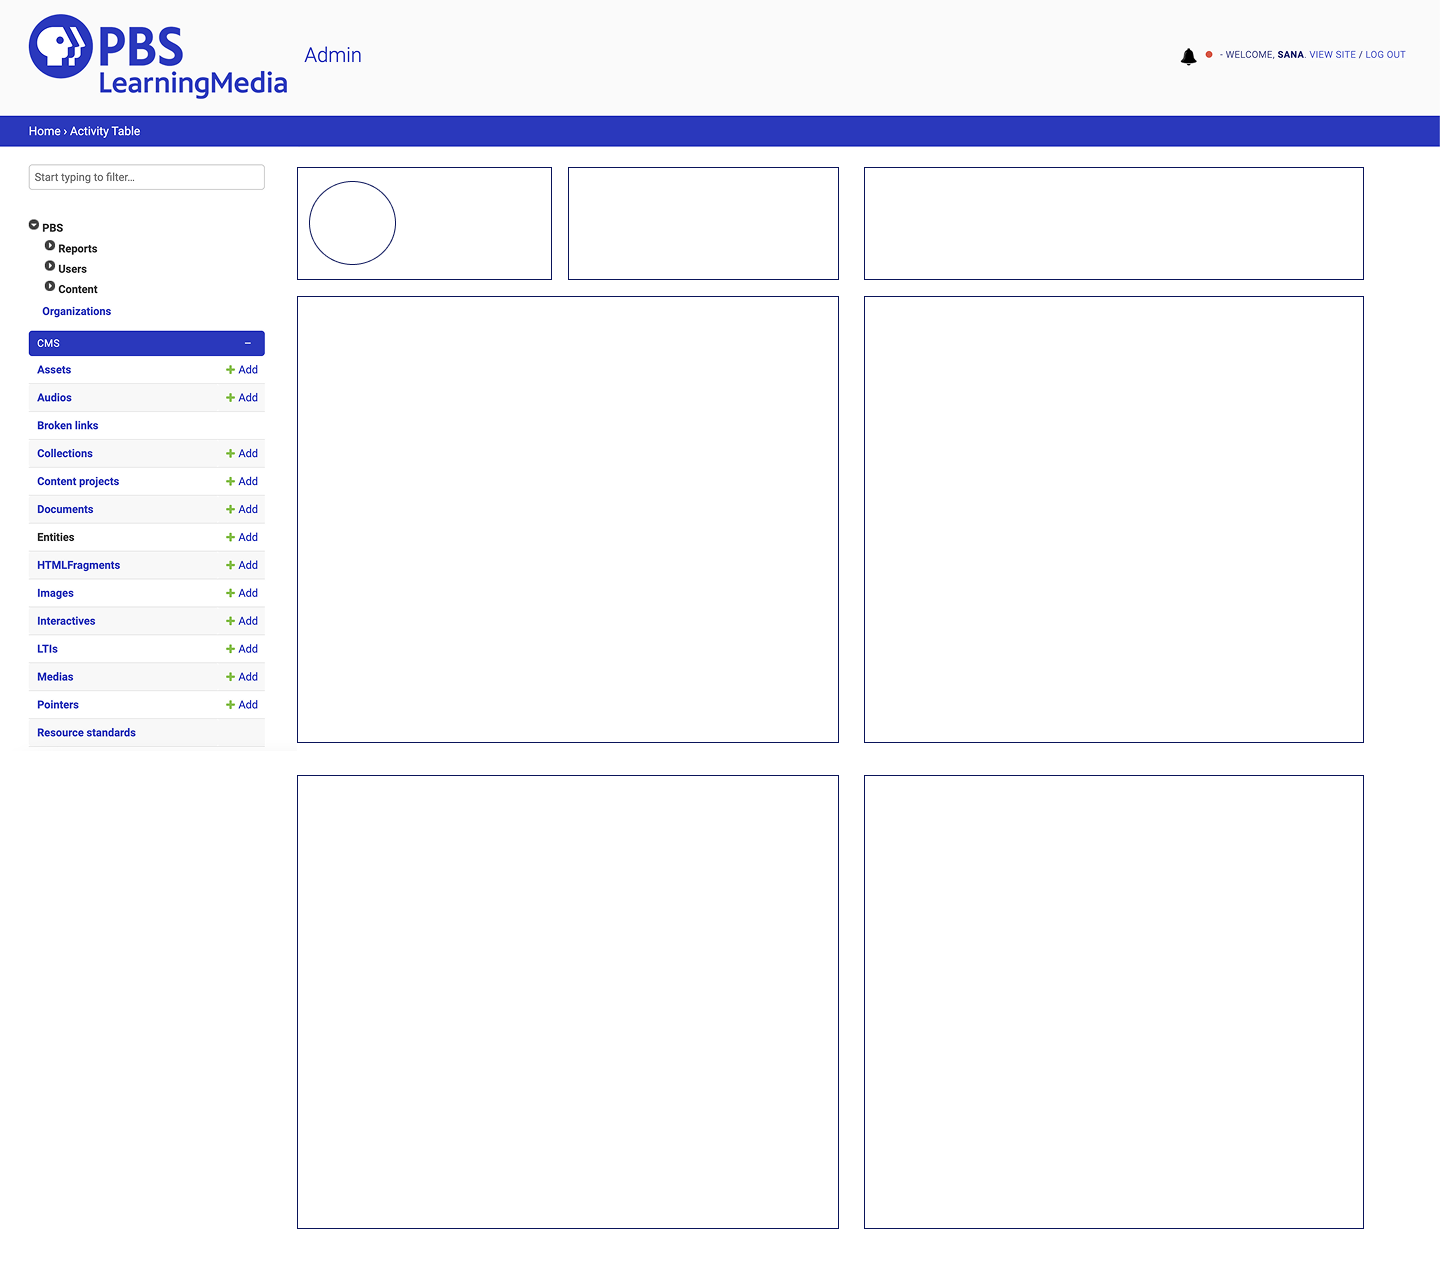
Lo Fi Wireframes
I then began to clean up the sketches and create a low fidelity wireframe to share with product and stakeholders.
MODIFYING DESIGN BASED ON FEEDBACK
In our revised dashboard view we:
Expanded the quick actions section
A comment preview section with the option to view history on the “Needs Action” section
A preview action for the “In Draft” section
Per conversations with users and stakeholders, we limited each table to have 7 items
Added a button to view all items that might need action
Listed in detail what each table column would be labeled as in addition to if each item was clickable or not
Additional Improvements
We also added a table for Content Projects, which consisted of larger projects that might have multiple resources or collections to help Producers keep track of larger projects in one place.
We also added buttons for “View All Resources” and “View All Collections” to differentiate the content types.
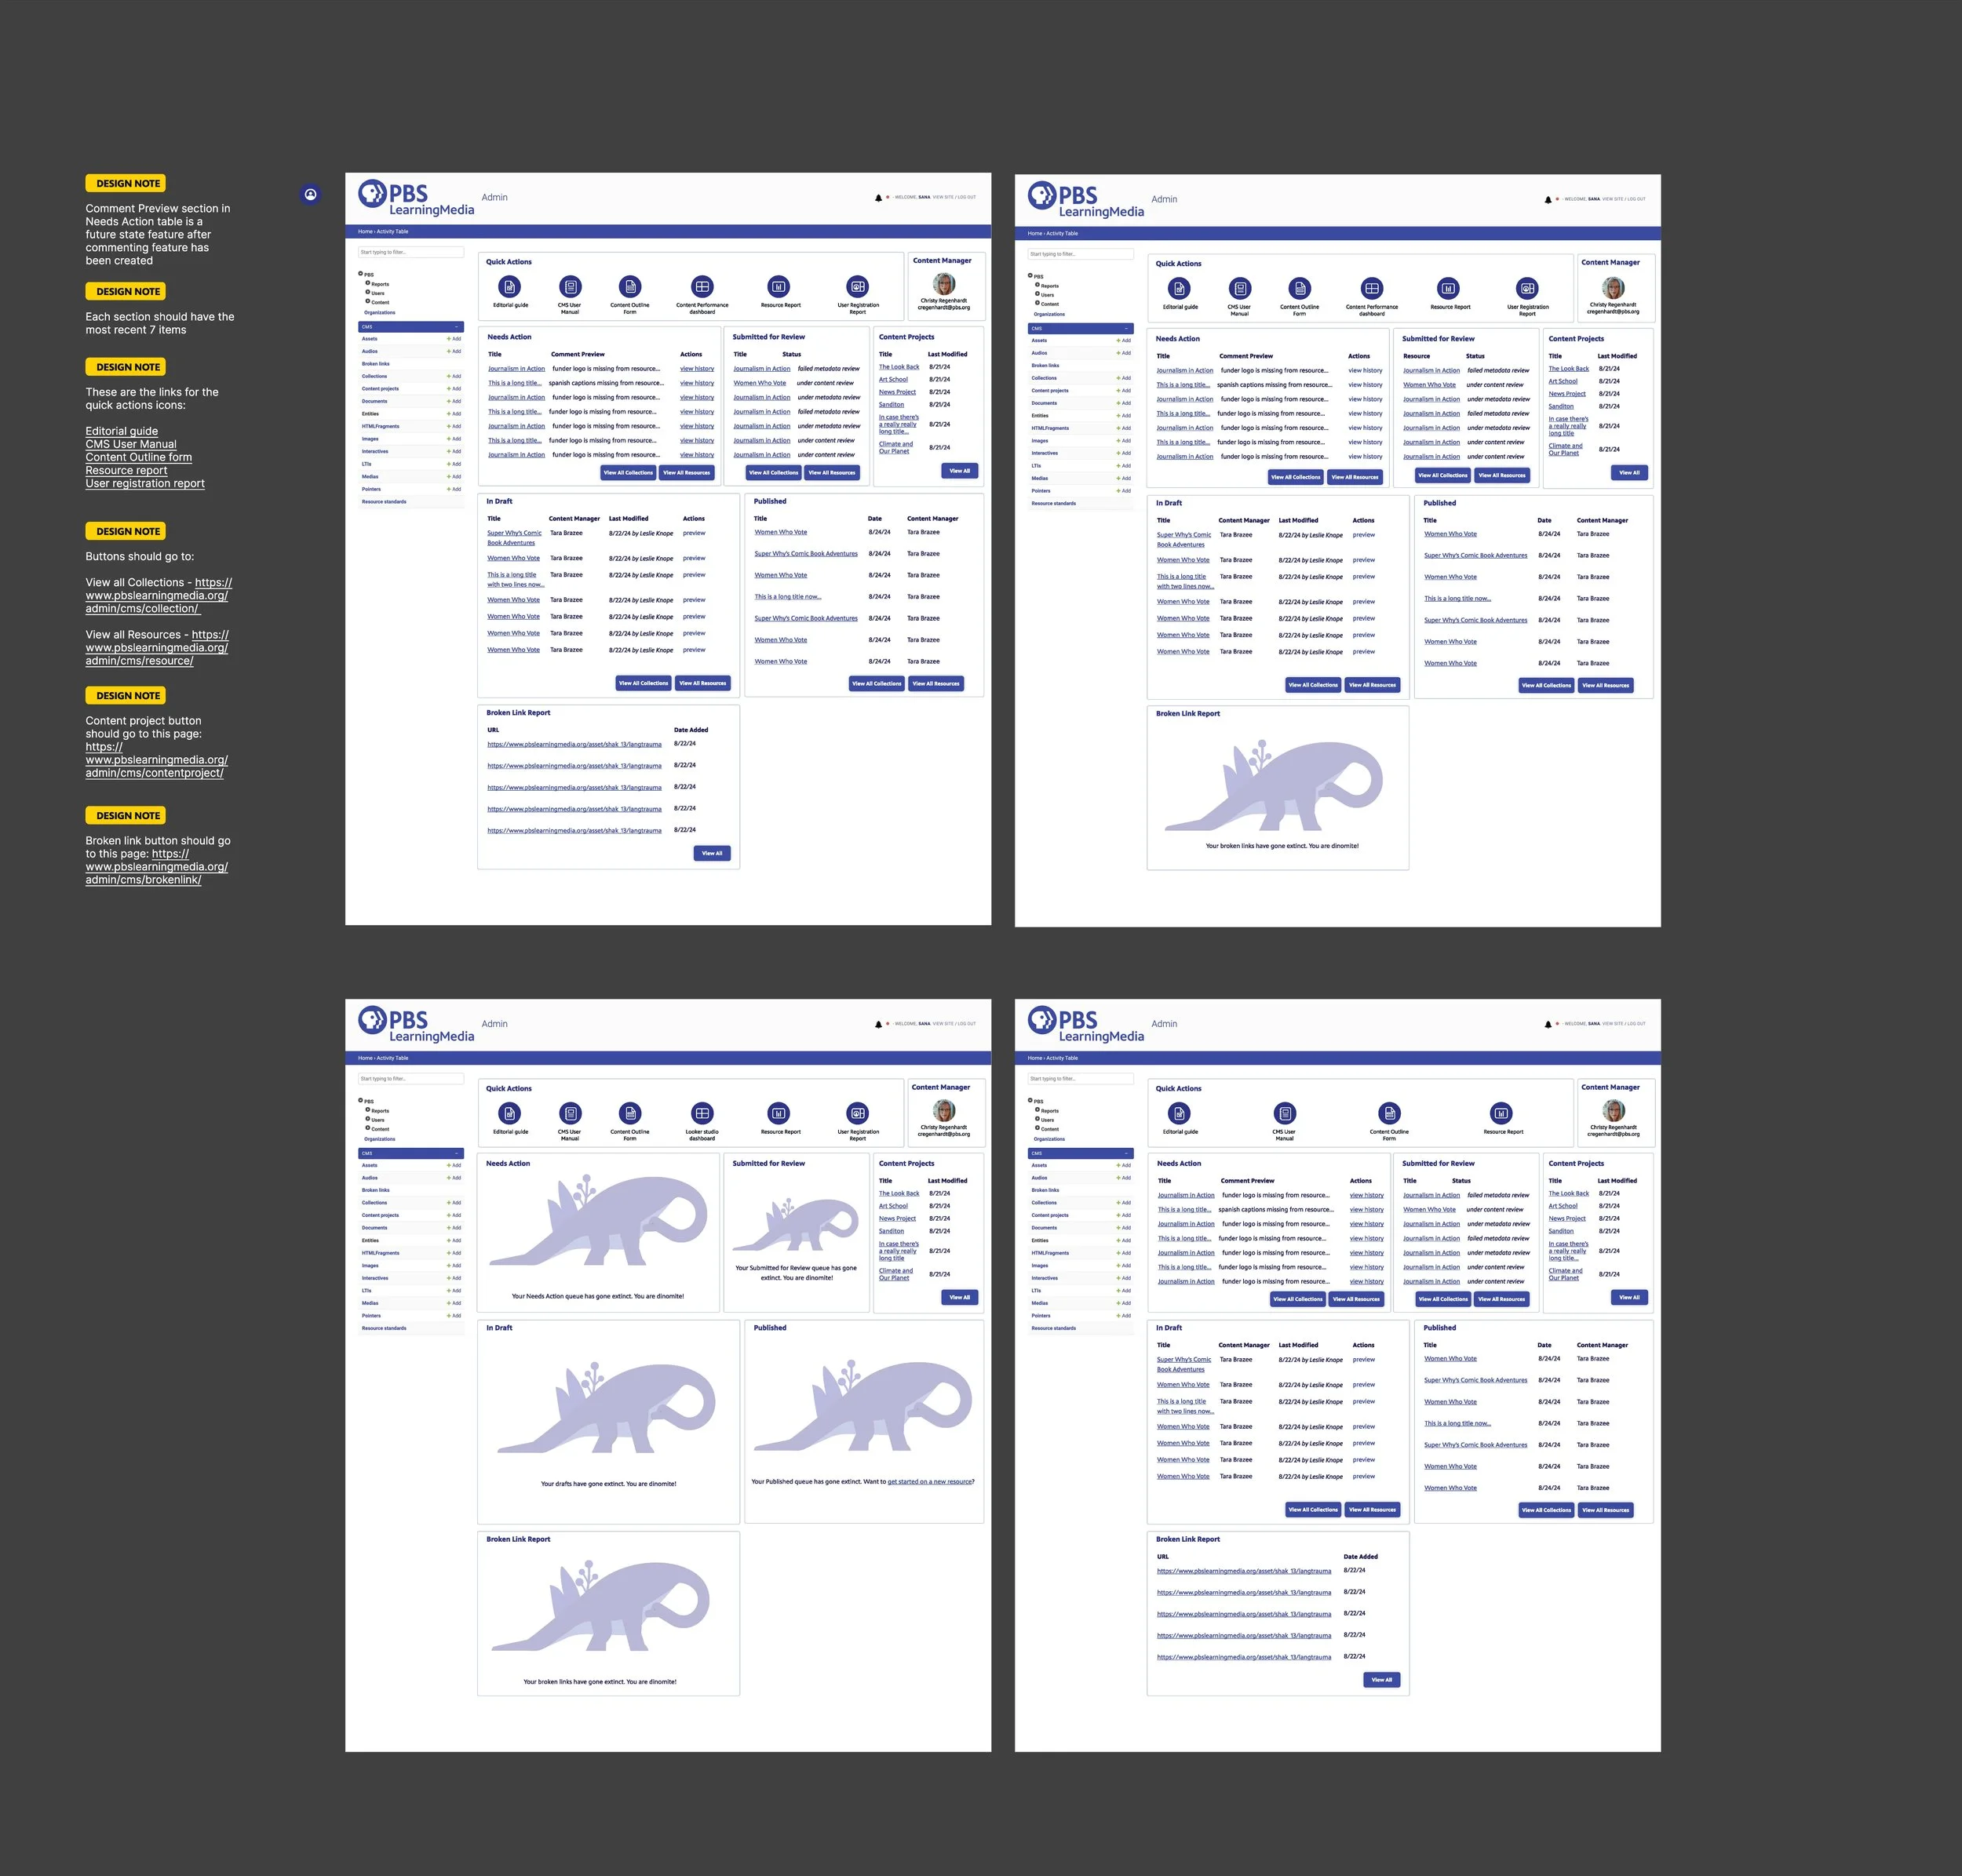
We also added an empty state for tables utilizing a PBS brand illustration. Users and stakeholders gave positive feedback saying that they loved how playful the message was: “Your broken links have gone extinct. You are dinomite!”
Finalized quick actions
Final Production Screens
Below are the final production screens with some notes for Developers. The screens include different states for different roles as Producers without Admin access for example would not have access to a User Registration Report as well as different tables in empty states. The Figma section also showcases notes for the developers for handoff.
REFLECTION + TAKEAWAYS
Investing in lower fidelity design can save time. Because our existing design system and components library in Figma are pretty comprehensive initially it can be easy to want to immediately go to a high fidelity design since we have the elements. But slowing down to sketch and build from the bottom actually ended up saving us time. Product also gave feedback that this approach ended up saving us a lot of time and is one we took forward to other projects.
Playfulness can be a great solution. I’ve had this takeaway in other projects too and continue to see this in my work. Just because a product is for an adult does not mean they will not appreciate playfulness if it is done in a thoughtful way.
THE IMPACT
Saved Time - Producers are now spending less time looking for next steps and can now directly take action.
Everything is in one place - This project got positive feedback from both internal PBS staff as well as Stakeholders and Producers saying that they found the solution quick, useful and delightful. The product team also appreciated the lower fidelity designs and visual user flows as a starting point for discussion and this approach has been used in future projects.